Recordings
The Recordings page provides the session context behind every customer issue. Most of the time, you'll arrive here from an issue surfaced through your CS tools or the in-app Report Issue modal — Sailfish links you directly to the relevant session and moment. You can also use AI-powered search to find related sessions, or browse by user and time range.
Search & Filtering
AI-Powered Search
Use the search bar at the top of the Recordings page to find sessions using natural language. Examples:
- "users who encountered a 500 error on checkout"
- "sessions with slow page loads on mobile"
- "users who visited the pricing page but didn't sign up"
Sailfish uses AI to interpret your query and return matching sessions.
Filters
Narrow results using the filter controls:
| Filter | Description |
|---|---|
| Page URL | Filter sessions that visited a specific page or URL pattern |
| Device | Filter by device type (desktop, mobile, tablet) |
| User | Search for a specific user by email or identifier |
| Date range | Sessions from a specific time window (up to 30 days back) |
Combine filters to find exactly the sessions you need — for example, mobile users who visited /checkout in the last 7 days.
The Timeline
The timeline shows every customer's journey, split by the devices they were using. Rather than showing isolated "recordings" in a list, Sailfish displays sessions on a temporal timeline so you can see when problems occurred relative to the user's full journey.
List View

Before selecting a user, the timeline shows a zoomed-out overview of all user sessions. This gives you a glanceable view of activity across your user base.
User-Selected View
Once you select a user, the timeline becomes interactive. You can zoom in and scrub to the exact moment a problem occurred.
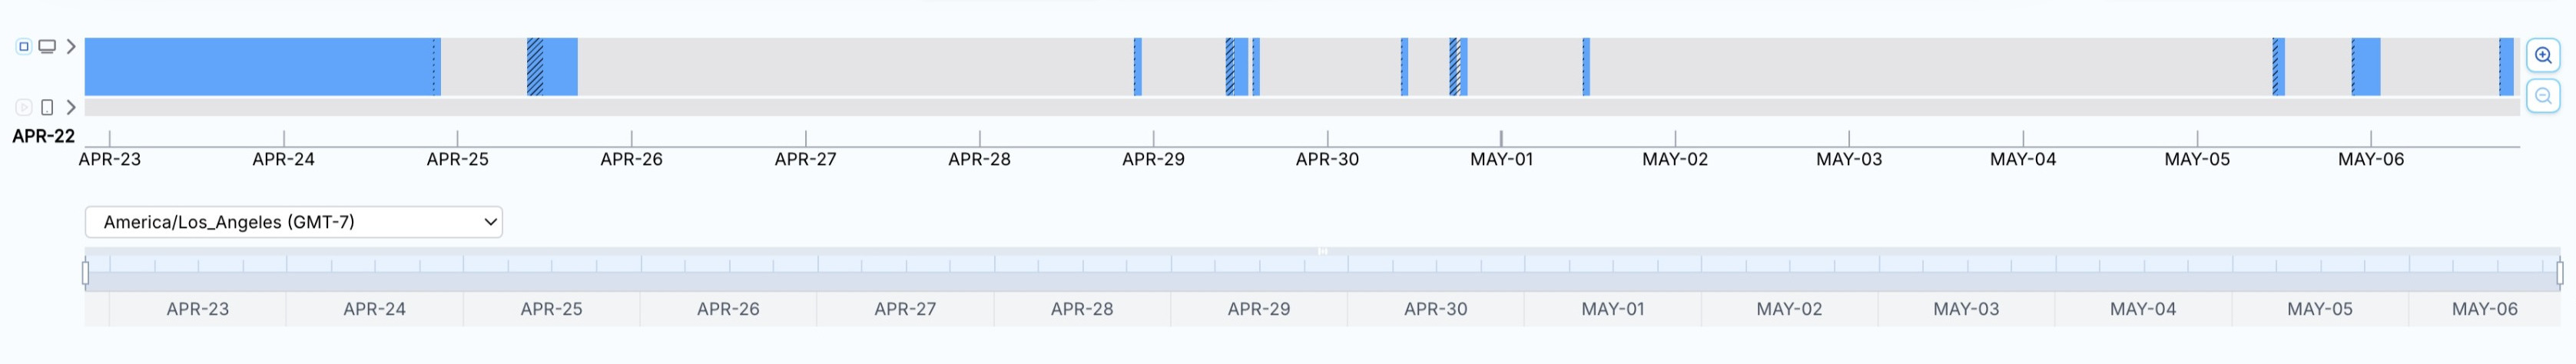
Adaptive Timeline

The top section of the timeline is zoomable. Drag to select a time range, or use scroll to zoom in/out. The timeline adapts its resolution as you zoom — showing more detail at higher zoom levels.
Journey Timeline

The bottom section shows the user's full journey with individual session spans. Each span represents a continuous period of activity. Colored markers indicate events like errors, page navigations, and user interactions.
Session Replay
When you click into a session, Sailfish plays back the user's experience using session replay. You see exactly what the user saw — page content, scroll position, mouse movements, and interactions — all reconstructed from recorded DOM changes.
Replay Controls
- Play / Pause — Start or stop playback
- Scrub — Drag the playback timeline to jump to any point
- Speed — Adjust playback speed (1x, 2x, 4x)
- Skip inactivity — Automatically fast-forward through idle periods
User Interaction Events
The replay timeline highlights specific events that occurred during the session:
| Event Type | Description |
|---|---|
| Clicks | User click events on buttons, links, and other elements |
| Navigation | Page transitions and route changes |
| Text edits | Input field interactions (content is masked for privacy) |
| Errors | JavaScript exceptions and console errors |
| Network failures | Failed API calls (4xx/5xx responses) |
Click any event marker on the timeline to jump directly to that moment in the replay.
Discovering the Problem a User Faced
Finding the User
Start by searching for the user by email, user ID, or name. If the user reported an issue through a connected customer source, their identity is already linked.
You can also browse the timeline to find users who were active during a time window when a problem was reported.
Finding the Time of the Problem
Once you've selected a user, zoom into the timeline around the time the issue was reported. Look for:
- Error and exception markers — Sessions flagged with issues
- Gaps in activity — The user may have abandoned the session
- Clusters of events — Rapid clicks or navigation often indicate confusion or frustration
Labeling an Issue
Examine Mode
Click the Examine button to enter examine mode. In this view, you can inspect individual events in the session — network requests, console logs, exceptions, and function spans — alongside the replay.
This gives you the technical context needed to understand what went wrong.
Create a Triage
Once you've identified a problem, click Create Triage to capture it. A triage bundles:
- The session and timestamp where the issue occurred
- Any notes you add about the problem
- A link back to the exact moment in the recording
Triages feed into the Triage Faster workflow where your team can prioritize and act on the issue.
Data Retention
Recordings are retained for 30 days. Sessions older than 30 days are automatically removed. If you need to preserve a specific session, create a triage or issue from it — those references persist beyond the recording retention window.