Customer Sources
Connect the tools where your customers report issues. Sailfish pulls in reports from these channels and automatically correlates them with the technical context needed to resolve them.
How Issues Flow In
Customer issues reach Sailfish through two paths:
- CS platform → Sailfish — A customer reports an issue in your CS tool (Zendesk, Salesforce, Pylon). The report is auto-categorized or manually escalated as a bug. Sailfish matches it to the user's session and correlates the technical context.
- In-app Report Issue modal — A user reports an issue directly from your application. Sailfish captures the session, a screenshot, and the full backend/frontend context from that moment.
Supported Sources
| Source | Status | Setup |
|---|---|---|
| Zendesk | Available | Connect Zendesk → |
| Salesforce | Available | Connect Salesforce → |
| Pylon | Available | Connect Pylon → |
| In-App Reporting | Available | Setup guide → |
Zendesk
Connect Zendesk to automatically correlate support tickets with Sailfish session data.
Setup
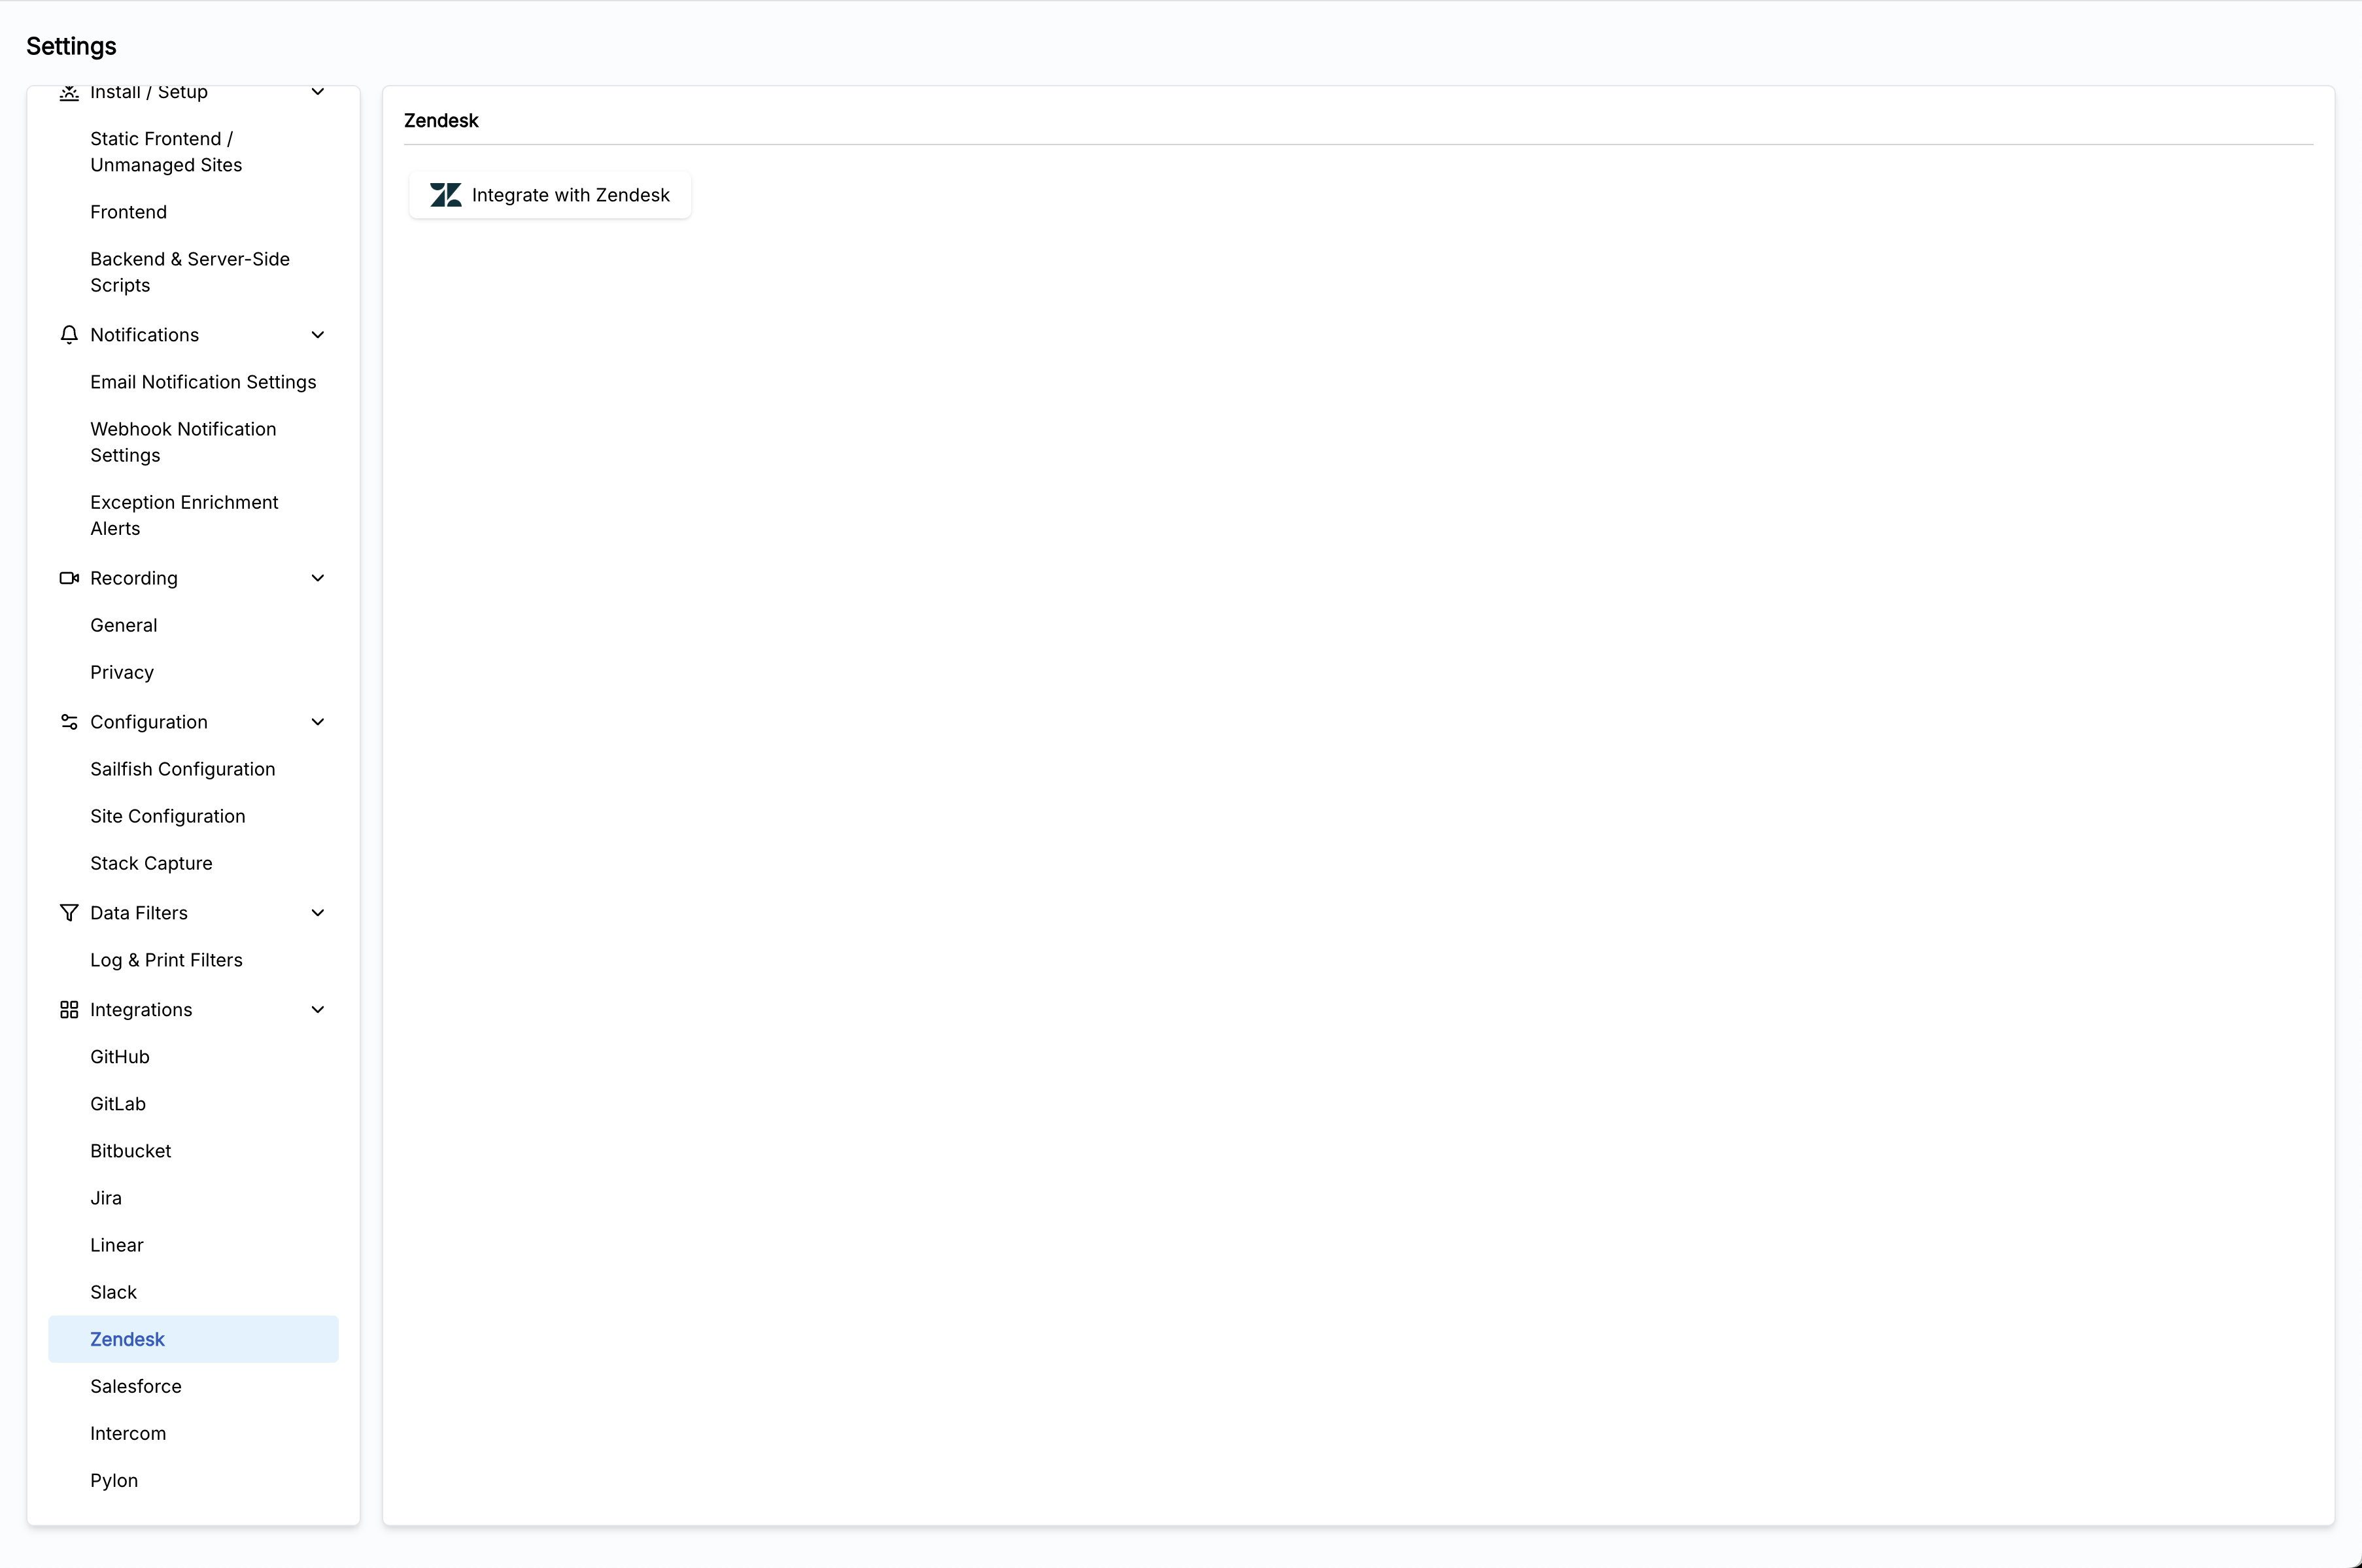
- Open the Zendesk integration settings in the Sailfish dashboard
- Click Connect
That's it — Sailfish handles the rest. Incoming Zendesk tickets are automatically matched to user sessions using the ticket requester's email address.
What You Get
- Support tickets automatically linked to the user's Sailfish sessions
- One-click navigation from a ticket to the exact session replay
- Full technical context (errors, network requests, logs) attached to each ticket
Salesforce
Connect Salesforce to correlate support cases with Sailfish session data.
Setup
Step 1: Connect in Sailfish
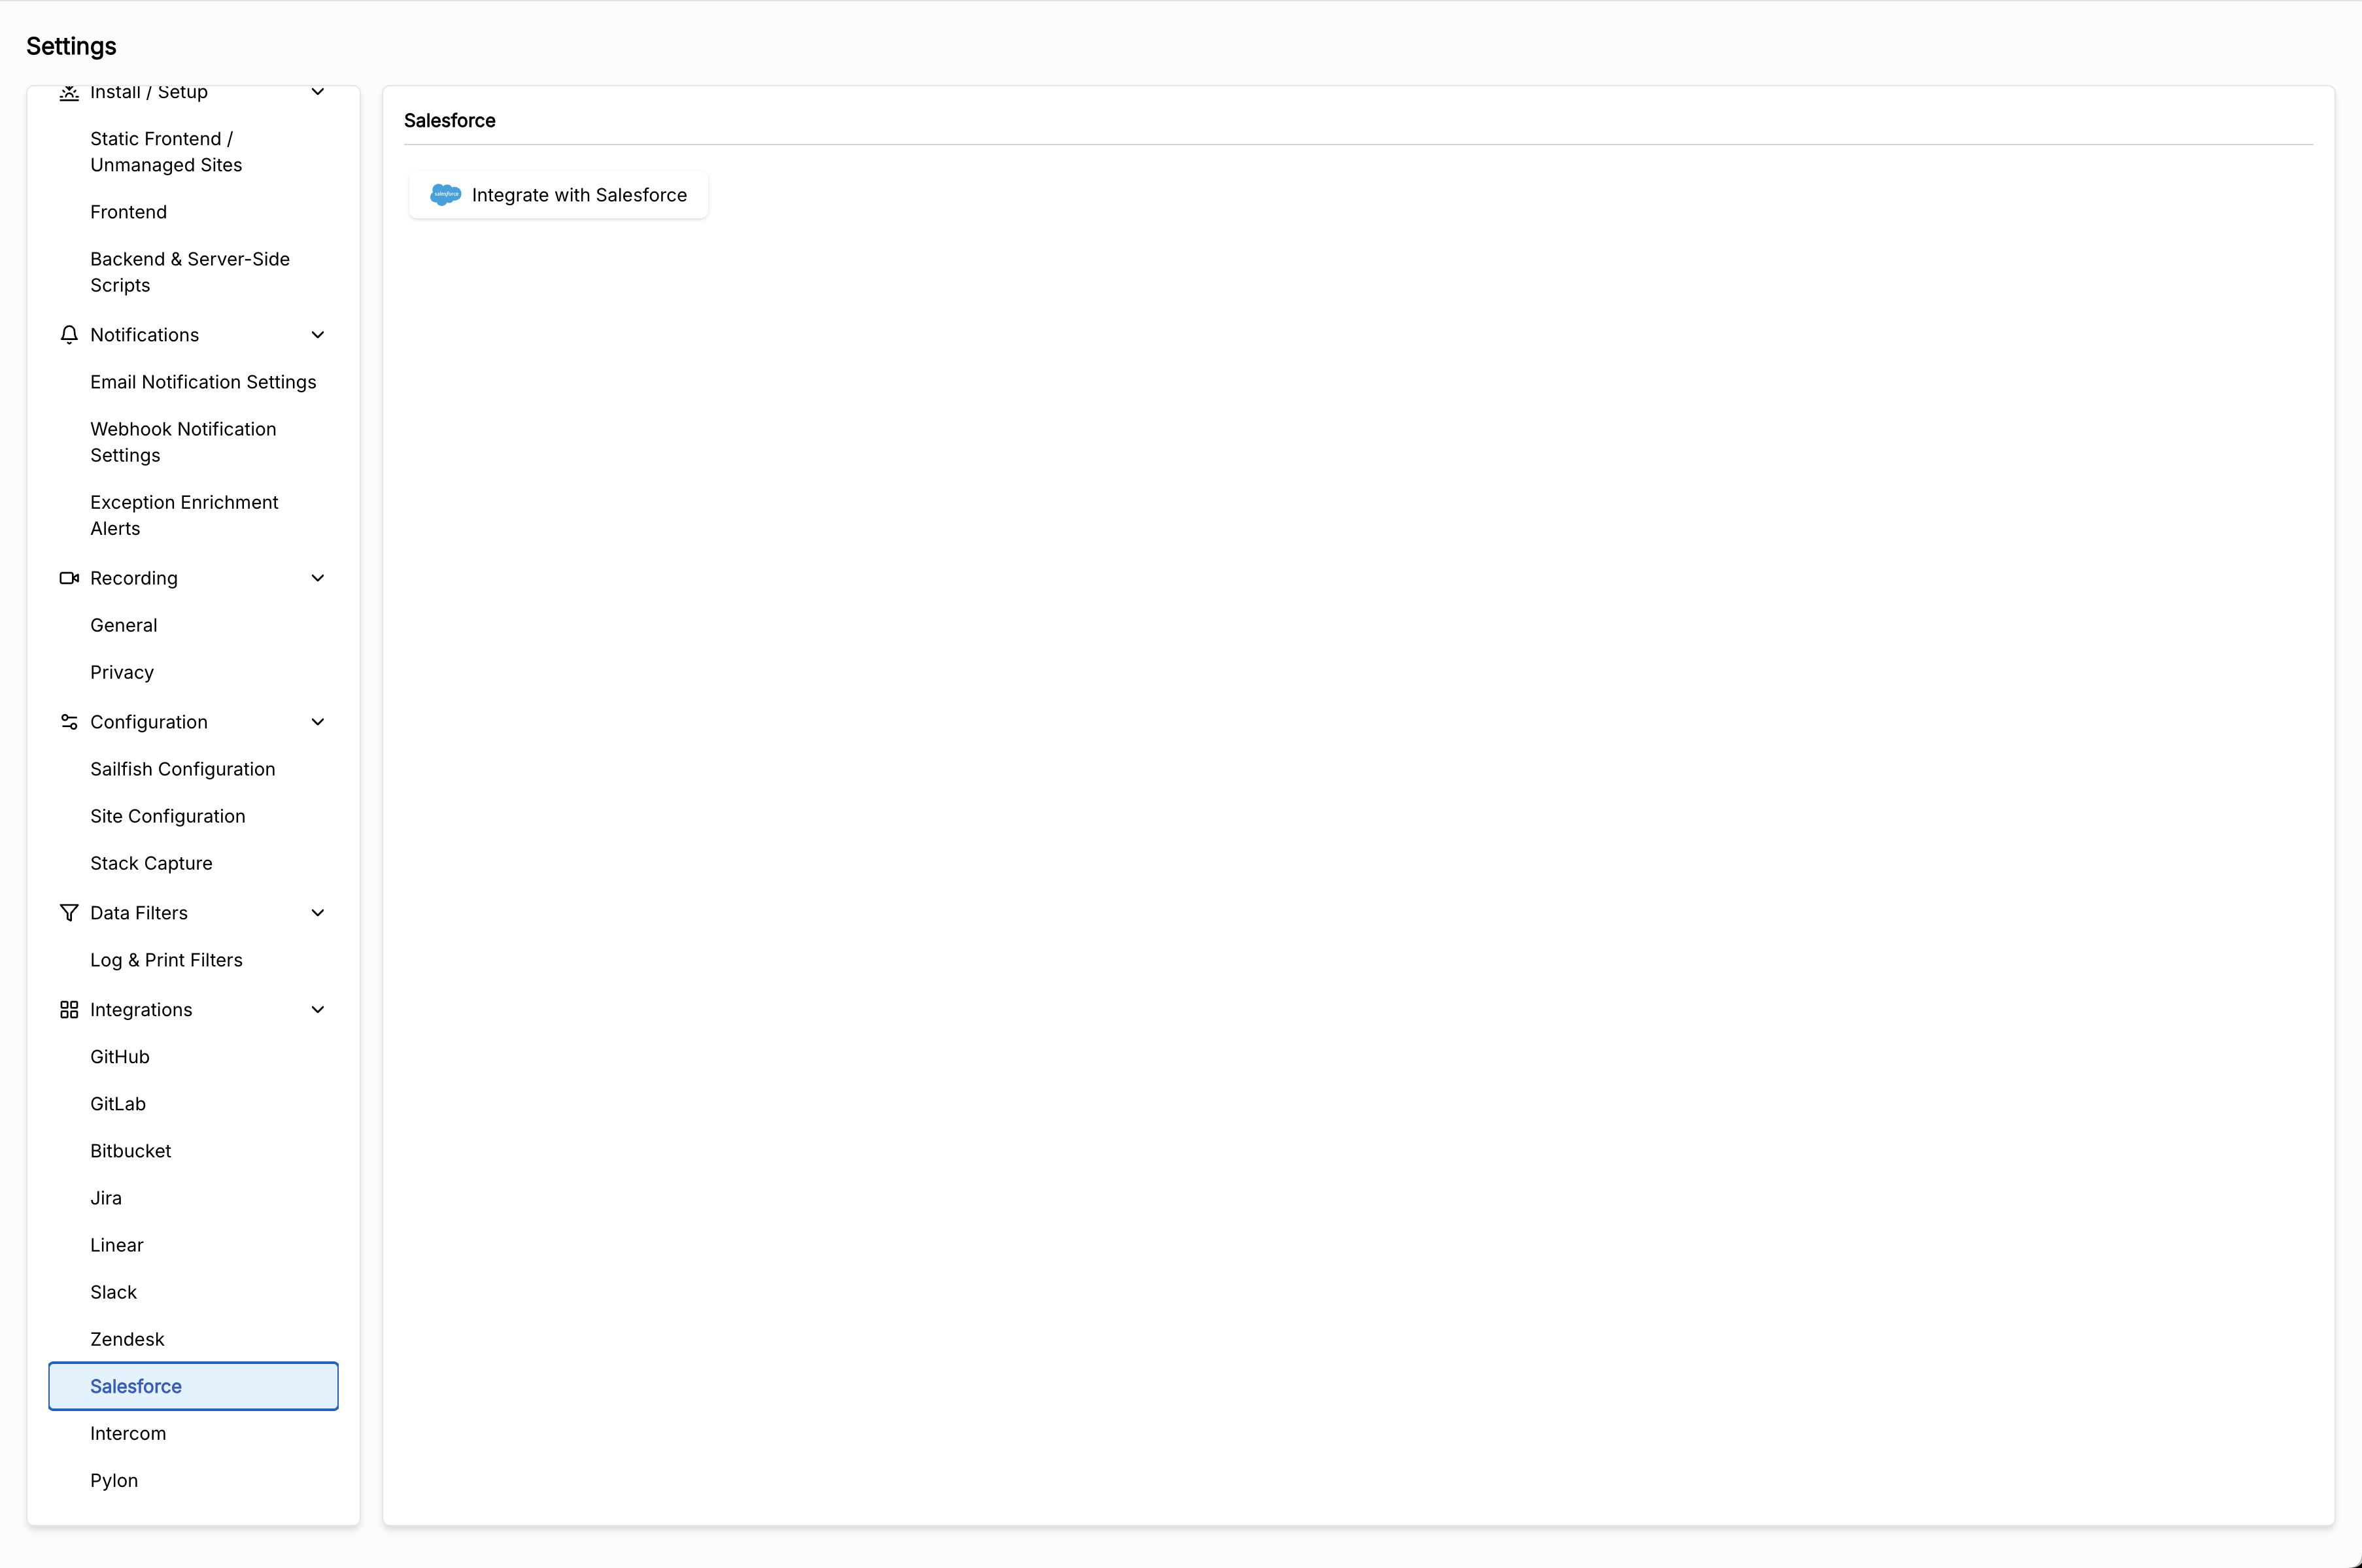
- Open the Salesforce integration settings in the Sailfish dashboard
- Click Connect
- Authorize access to your Salesforce org
Step 2: Add the Sailfish panel to your Salesforce case view
After connecting, add the Sailfish component to your Salesforce case page layout so agents see session context inline:
- Open Salesforce Setup > Object Manager > Case > Lightning Record Pages
- Edit your active case page layout in the App Builder
- Drag the Sailfish component onto the page
- Save and activate the updated layout
Once configured, agents see Sailfish session data directly within the Salesforce case view — no tab switching required.
What You Get
- Sailfish session context embedded directly in the Salesforce case view
- Full technical context (errors, network requests, logs) alongside case details
- One-click navigation from a case to the exact session replay in Sailfish
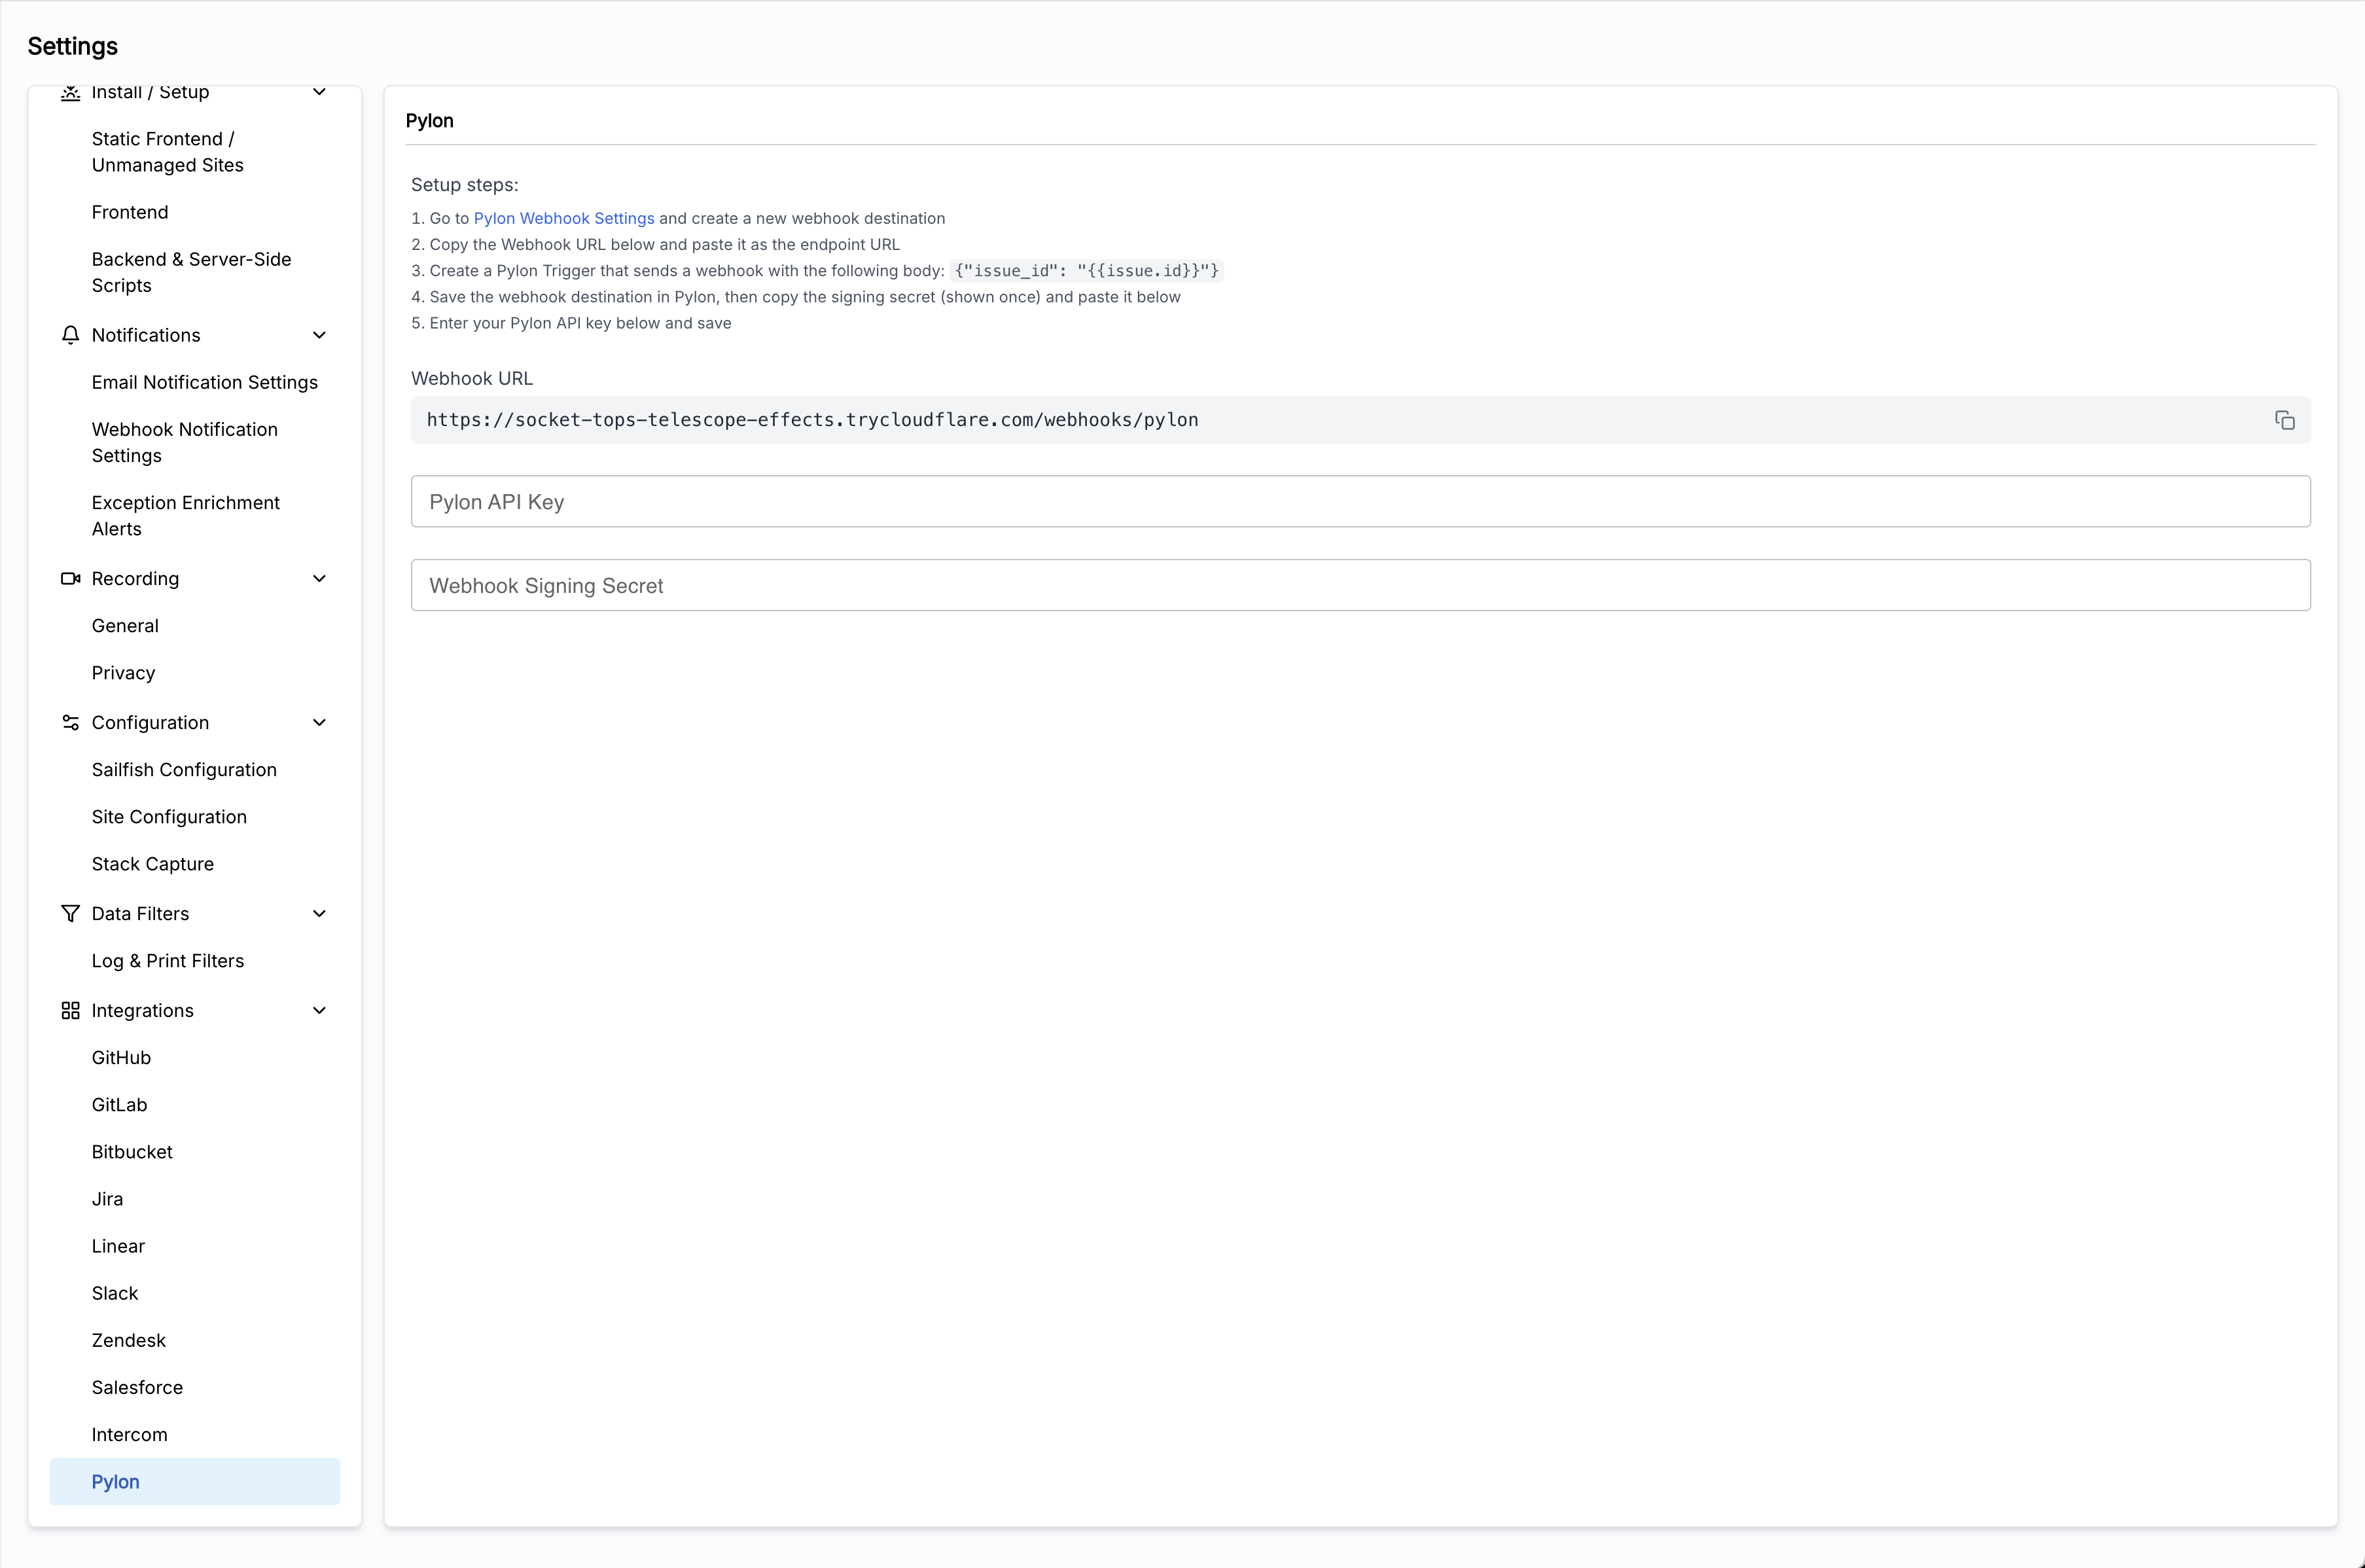
Pylon
Connect Pylon to capture customer-reported issues and correlate them with session data.
Setup
Step 1: Get a Pylon API key
- In Pylon, navigate to Settings > API
- Generate a new API key
- Copy the key — you'll need it in the next step
Step 2: Create a webhook in Sailfish
- Open the Pylon integration settings in the Sailfish dashboard
- Find Pylon and click Connect
- Enter your Pylon API key
- Copy the webhook URL that Sailfish generates
Step 3: Set up a trigger in Pylon
- In Pylon, navigate to Workflows > Triggers
- Create a new trigger for the conversation events you want to send to Sailfish (e.g., new conversations, bug escalations)
- Add a Webhook action and paste the Sailfish webhook URL from Step 2
- Save and activate the trigger
Once configured, matching Pylon conversations automatically flow into Sailfish and are correlated with user sessions.
What You Get
- Customer conversations automatically linked to the user's Sailfish sessions
- Full technical context (errors, network requests, logs) attached to each conversation
- One-click navigation to the exact session replay
In-App Reporting Widget
The Sailfish in-app reporting widget lets your users report issues directly from your application. When a user submits a report, Sailfish automatically captures:
- The user's current session and page
- A screenshot of what they see
- Their description of the problem
- Full backend and frontend context from that moment
See In-App Reporting for setup instructions.